

프로메테우스(Prometheus), 그라파나(Grafana)는 쿠버네티스 클러스터 상에서 모니터링을 위한 오픈소스이다.
프로메테우스의 역할은 metric data를 수집하여 저장하고, 그라파나는 프로메테우스로 수집한 데이터를 보기 좋게 dashboard 상에서 그래프같은 형태로 시각화 해준다.
쿠베니터스의 컨테이너 인프라 환경에서는 마이크로서비스 형태로 많은 app 들이 개발되어 배포되기 때문에, 각 app들의 상태를 확인하기 위해 모니터링 시스템이 아주 중요하고, 프로메테우스와 그라파나는 좋은 선택지가 된다.
프로메테우스의 특징은 다음과 같다.
- 수집하려는 대상 서버에 exporter를 두어 중앙 서버에서 메트릭을 수집한다.
- 데이터 수집은 일정 주기만큼 pulling 방식으로 이루어지는데, 이는 프로메테우스 중앙서버가 exporter의 http endpoint에 접근하여 대상 서버에서 metric을 수집하는 것을 의미한다.
- PromQL이라는 시계열 함수로 쿼리를 쉽게 구축할 수 있음
- alertmanager를 통해 threshold 기반으로 알림을 생성할 수 있다.
Prometheus + Grafana 설치
먼저 공식 git 저장소에 있는 manifest를 가져와 설치하는 방법이다.
# 로컬 저장소 생성
git init monitoring
cd monitoring

# remote 추가
git remote add -f https://github.com/prometheus-operator/kube-prometheus.git

# sparse checkout 설정
git config core.sparseCheckout true
echo "manitests" >> .git/info/sparse-checkout

# 다운로드
git pull origin main

# 설치
kubectl apply --server-side -f manifests/setup
kubectl wait \
	--for condition=Established \
	--all CustomResourceDefinition \
	--namespace=monitoring
kubectl apply -f manifests/

# 설치 확인
kubeclt get pods -n monitoring
혹은 helm repo를 가져와 설치할 수 있다.
// 헬름 레포 추가
helm repo add prometheus-community https://prometheus-community.github.io/helm-charts

// 헬름 레포 압축해제
helm pull prometheus-community/kube-prometheus-stack --untar

// 설치 명령어
helm upgrade prometheus Desktop/kube-prometheus-stack/ -n monitoring --install --create-namespace
설치 이전에 grafana dashboard에 접속하기 위해 grafana의 service type을 NodePort로 변경해준다.
git 저장소로 설치하는 경우 "manifests/grafana-service.yaml" 파일을,
helm repo의 경우 "kube-prometheus-stack/charts/grafana/values.yaml"에서 type을 NodePort로 설정하고 nodePort 번호를 지정해주면 된다.
아래는 helm repo에서 values.yaml 파일을 수정한 결과이다.
# kube-prometheus-stack/charts/grafana/values.yaml 서비스 타입 수정
service:
  enabled: true
  type: NodePort
  loadBalancerIP: ""
  loadBalancerClass: ""
  loadBalancerSourceRanges: []
  port: 80
  targetPort: 3000
    # targetPort: 4181 To be used with a proxy extraContainer
  nodePort: 30001
  ## Service annotations. Can be templated.
  annotations: {}
  labels: {}
  portName: service
  # Adds the appProtocol field to the service. This allows to work with istio protocol selection. Ex: "http" or "tcp"
  appProtocol: ""
설치가 정상적으로 완료되면 다음과 같은 pod들이 떠있는 것을 확인할 수 있다.
$ k get pod -n monitoring
NAME                                                     READY   STATUS    RESTARTS   AGE
alertmanager-prometheus-kube-prometheus-alertmanager-0   2/2     Running   4          251d
prometheus-grafana-5795c58ffd-2dkw5                      3/3     Running   3          251d
prometheus-kube-prometheus-operator-5f475fd846-4ss8h     1/1     Running   3          251d
prometheus-kube-state-metrics-59b5d58f8f-ltmzr           1/1     Running   3          251d
prometheus-prometheus-kube-prometheus-prometheus-0       2/2     Running   7          251d
prometheus-prometheus-node-exporter-j89zm                1/1     Running   4          251d
prometheus-prometheus-node-exporter-lbj84                1/1     Running   1          251d
Prometehus dashboard 접속
사실 그라파나를 이용하면 prometheus 대시보드에 접속할일이 없지만 그래도 감을 익힐 수 있다.
프로메테우스 서비스는 ClusterIP이기 때문에 임시로 포트 포워딩을 통해 접속해보자.
접속은 <SERVER_IP>:7654 포트로 접속하면 된다.
# 프로메테우스 대시보드 포트 포워딩
k port-forward -n monitoring statefulsets/prometheus-prometheus-kube-prometheus-prometheus -- address 0.0.0.0 7654:9090
프로메테우스 대시보드에 접속하면 아래와 같은 화면이 나온다.
Expression에는 query를 날려 자기가 원하는 metric을 조회할 수 있다.

예를 들어 컨테이너들이 사용하고 있는 메모리 사용량을 보기 위해 expression에 "container_memory_usage_bytes"을 입력하면 metric 결과가 쫘르륵 나온다.
table 형태로 보기힘들어서 Graph를 선택하면 아래와 같이 각 컨테이너에 대한 메모리 사용량을 그래프로 보여준다.

다음으로 위 메뉴에서 Alert를 눌러보면 다음과 같은 화면이 나온다.
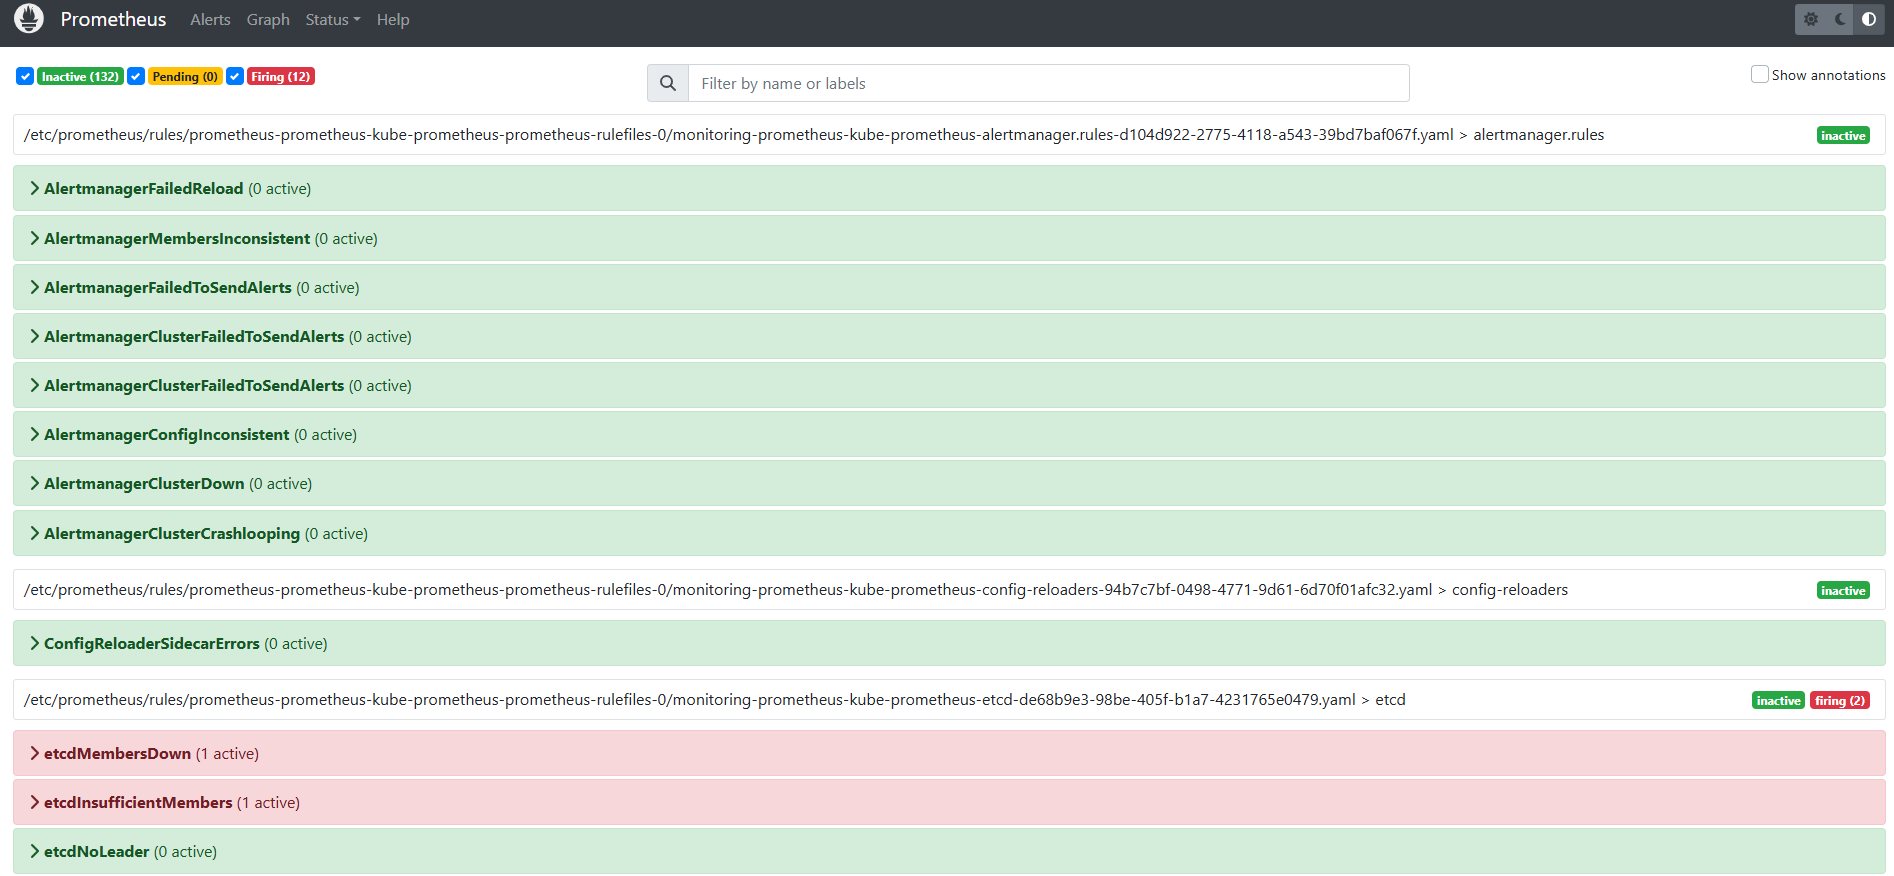
Alerting Rule은 PromQL이나 Recording Rule을 만족하는 결과에 대한 알람 조건을 지정한다. 조건을 충족하는 결과가 발생할 경우 해당 데이터에 대해 ALERTS라는 시계열에 저장되는 알람을 생성해낸다.
- INACTIVE: 정상 상태
- PENDING: 알람 조건에 충족하여 알람이 생성된 상태이다. Alert Rule에 정의된 "for" 기간 동안 pending 상태일 경우 "FIRING" 상태가 된다.
- FIRING: pending 상태가 오래 지속되어 문제가 될 경우. FIRING 상태에 진입하면 notification을 alert manager에게 전송한다. 상태가 해결되면 다시 INACTIVE 상태로 변경된다.

마지막으로 위 메뉴에서 Status > Targets를 누르면 프로메테우스가 수집하고 있는 metric들의 endpoint를 확인할 수 있다.
새로운 metric을 수집하려고 endpoint를 등록할 경우에 잘 등록되었는지 확인할 수 있다.
Grafana Dashboard 접속
위에서 봤듯이 프로메테우스 대시보드에서도 metric을 확인할 수는 있지만, 뭔가 굉장히 복잡하고 우리가 원하는 대로 보기 힘들다. 특히 특별한 조건을 만들기 위해서는 PromQL을 이용하여 필터링을 해야하는데 이또한 매우 귀찮은 일이다.
따라서 Grafana 대시보드를 이용하여 모니터링 결과를 직관적이고 편리하게 구성하고 볼 수 있다.
$ k get svc -n monitoring
NAME                                      TYPE        CLUSTER-IP       EXTERNAL-IP   PORT(S)                      AGE
alertmanager-operated                     ClusterIP   None             <none>        9093/TCP,9094/TCP,9094/UDP   251d
prometheus-grafana NodePort 10.98.16.135 <none> 80:30001/TCP 251dgrafana에 접속하기 위해 nodePort를 확인하고 접속해보자.

맨처음 로그인 페이지가 나오는데, 초기 ID/PW는 admin/admin 으로 접속하면 된다.
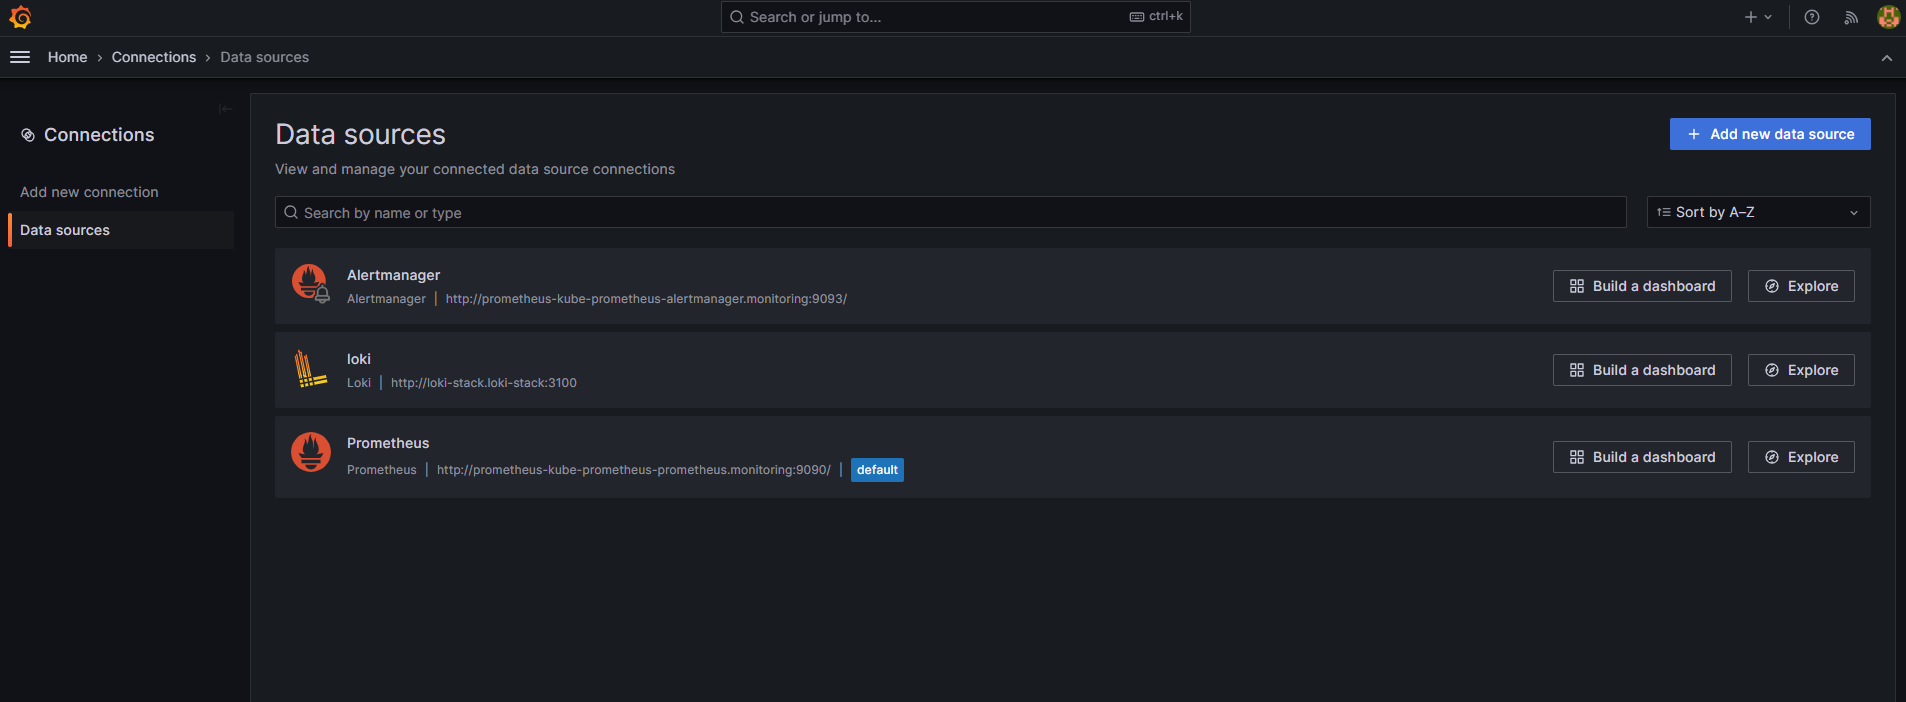
먼저 그라파나에서 프로메테우스 metric data를 시각화할 수 있도록 datasource를 연결해야 한다.
좌측 상단의 메뉴를 눌러 Connections > Datasource로 진입하여 prometheus가 정상적으로 연결되어있는지 확인하자.
만약 없다면 [+Add new data source] 버튼을 눌러 prometheus를 선택하고 Connection server URL에
"http://prometheus-kube-prometheus-prometheus.monitoring:9090/"를 입력하여 연결해주면 된다.

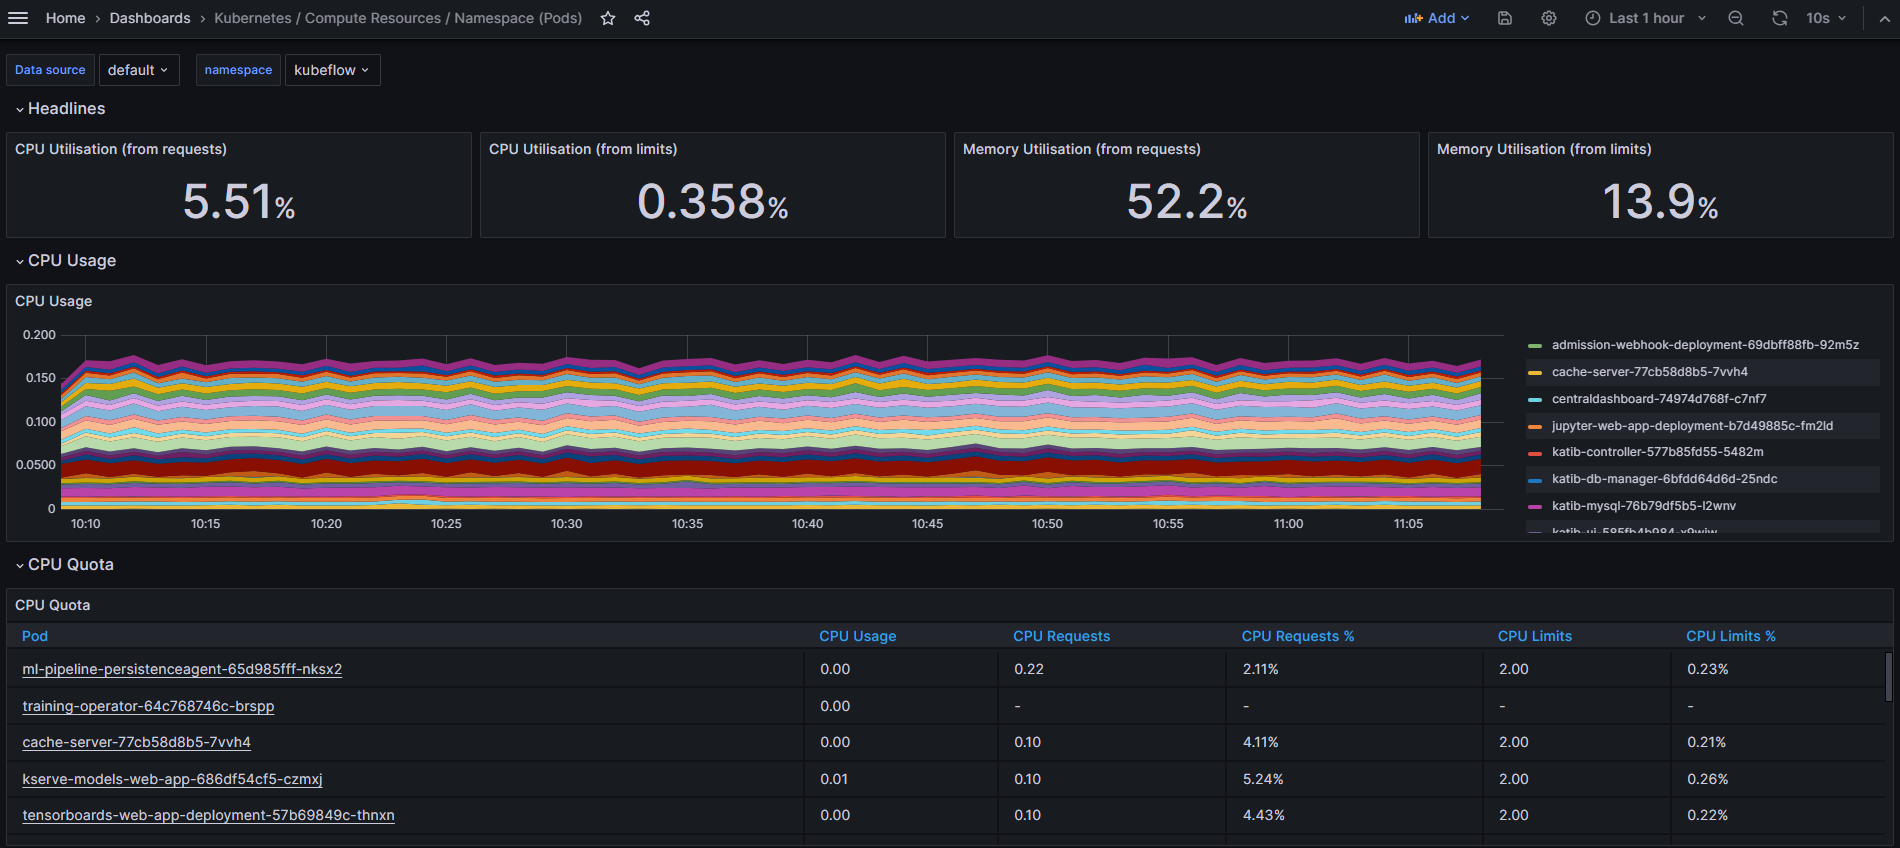
다음으로 Home > Dashboards로 접속하면 기본적으로 제공되는 시각화 대시보드들이 존재한다.

여기서 "Kubernetes / Computer Resources / Namespace (Pods)"로 들어가보자
해당 대시보드는 쿠버네티스에서 특정 네임스페이스에 존재하는 파드들의 resource 사용량을 보여준다.
왼쪽 위에서 namespace를 선택하면 아래처럼 CPU/Memory 사용량에 대한 metric 통계가 나오게 된다.
'인프라' 카테고리의 다른 글
| [Docker] Dockerfile 명령어 및 작성예시 (1) | 2024.12.17 |
|---|---|
| Prometheus+Grafana로 Triton Inference Server 모니터링 하기 (0) | 2024.12.03 |
| [Kubernetes] Helm과 Kustomize 비교 (0) | 2024.10.07 |
| [Kubernetes] 쿠버네티스 Component 동작으로 이해하기 (0) | 2024.05.03 |
| [Kubernetes] 쿠버네티스 기능 이해하기 - PVC, PV / Deployment / HPA / Service (0) | 2024.05.02 |